
Salesforce 1 Lightning Connect to SAP - Part 2 – Debug your Connection
As a follow up to my previous blog Salesforce 1 Lightning Connect to SAP - Step by Step Guide I wanted to give salesforce developers / administrators the ability to debug the Lightning Connection they had setup. Before we get too involved in the debugging aspects of Lighting Connect you should understand that salesforce has built this based upon the industry standards of the oData protocols http://www.odata.com. Please understand that the URL string that you are defining in salesforce Lightning Connect has 3 primary components they are:
Service Root URL – Specifies the computer you are accessing and which protocol you are using (oData of course!).
Resource Path – The functional area you are accessing (sales orders, invoices, etc.).
Query Options – These are additional parameters you can provide to the query string to filter the data.

When you code Apex commands referencing the External Objects (mySAPdata__x) salesforce is converting your select statements into oData query options to the target service root URL you have specified! Now compare this to your Lightning Connect setup you have created:
https://sapes1.sapdevcenter.com/sap/opu/odata/sap/SALESORDERXX/
(Remember Service Root URL and Resource Path, SF will pass the query options via your apex code!)

Now that you have an understanding of the components of the Lightning Connect URL string, you can proceed to debug an issues you may have encountered.
There are a few ways to perform this debugging, some are better than others. Ideally you will want to obtain an SAP logon with developer access to fully understand what is happening when you query the SAP system. However, you may not get the access you need so you may have to try some of the steps I have outlined here. They include:
Option 1 - Obtain an SAP Logon and set a breakpoint in SAP using SAPGUI (Best Method).
This is probably the best method since you can see the results from BOTH sides connection. But company policy may restrict access to your SAP system.

Option 2 – Use oData Parameters to list data (Better Method)
Use parameters that are available to assist you in understanding the data that has been returned to you.

Option 3 – Request an SE16 Listing of Data (Good Method)
Request from one of your SAP team members provide you with an SE16 List of the data you are trying to query. SE16 is a method to display table entries similar to using the SF data loader to look at SF data.

Since option 1 and 3 require feedback from others, I will focus on option 2 which will allow you the ability to perform some basic investigation yourself. You don’t have to be inside a salesforce instance to perform these tests, since we are just viewing the data. Normally, you don’t have to be exposed to the 3rd component of the oData query string, normally handled automatically by your Apex calls, but in this case we wish to view our sample dataset to confirm we are properly returning data.
$metadata Query Parameter
One of the first options is to view the defined data fields using the $metadata query. As listed above this returns back to you the fieldnames and the attributes (character or numeric) of each of the fields. If you open up your browser and enter the following URL string you can review the metadata returned from your SAP system. This parameter $metadata is an oData standard that is used to return field values from your connection! Here is a screen shot of this:

Another useful parameter is the “Debug” Parameter for SAP
Now that you understand the query portion of the URL, let’s try using different commands that are available to you. One useful command that SAP provides is the Debug Command. This parameter helps you understand the components of your URL string and gives you “debugger like” tabs that you can inspect. When entering your URL string you need to append to the end of your URL string.
?sap-ds-debug=true
Now SAP will respond with a formatted list that will help you understand what SAP has detected from your oData query.

Note on the above screen you now have several “Tabs” including: Body, Request, Response, Server, URI and Runtime. Pressing on each of these tabs will give you information about your oData query request. Here is the Request Tab of the oData query

Here is the Response Tab of the query, note the HTTP request response is “OK”

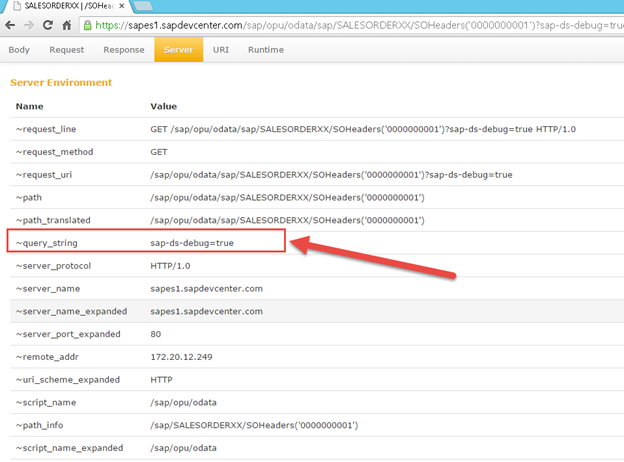
Here is the Server Tab of the request, note the “Query String” is our debug options.
Note the Runtime Tab gives us a “Stack Trace” of the routines that were executed to complete the request.

While not the “perfect” way to debug, it is at least an option for the salesforce user to understand the data that is being returned. Why not try using other SAP sales order numbers and review your results
I hope this next in a series of blog posting was helpful to the Salesforce developer / administrator! Time for another cup of Joe!
